Demark Indicators are signals use to predict big trend reversals (buy the dip or sell the rip). The pattern is a very counterintuitive, you can read more here. An interesting person had to have come up with this. In any case, I was interested in this because of how strange it is. Also, as far as a coding out complex logic its just complicated enough. I have tried a few times to get the logic coded out using pandas syntax. That was taking too long, Spreadsheet software is a perfect solution to manipulate data right in the cell and it is easy to chain logic and calculations. I also wanted to showcase my analysis process of focusing on generating actionable results. The Github Repository for this project can be found here.
Process
Going into this I wanted to see if the Demark Countdown 13 Sell/Buy works as a trend reversal signal, any characteristics to help improve the odds when selecting trades, and what the target holding period should be for these trades. I gathered a few years of return data for almost 200 stocks and ETFs using Google App Scripts and Google Sheets to apply Demark Indicator Logic. Finally, I loaded the data into a Google Colab Python notebook and performed an analysis to answer my questions. A hurdle of 2% was added as a breakeven for the trades to be more conservative with the assumptions.
Results
While it works in some cases. You really need the right security and market conditions to make the strategy worthwhile. The Demark 13 Buy events were more rare but had marginally better return profiles. Individual company stocks did better than ETFs and holding at least 14 days yielded the best results. My next step would be to improve the stock selection criteria to try and increase the results.
| Equities | 197 |
| Observations | 320,552 |
| Demark Countdown Buy Events | 1801 |
| Demark Countdown Sell Events | 4524 |
Question: What is the Optimal Holding Period for these trades?
Sell Events Return Distribution

| Return Period | % of Events Above 2% | Mean Return | Standard Deviation | Sharpe | Sortino |
|---|---|---|---|---|---|
| 3 Days | 14.5 | -0.3 | 3.7 | -0.3 | 0.02 |
| 7 Days | 22.9 | -0.2 | 5.9 | -0.2 | 0.01 |
| 14 Days | 28.7 | -0.5 | 8.5 | -0.2 | 0.01 |
| 21 Days | 29.0 | -0.8 | 10.0 | -0.2 | 0.02 |
Buy Events Return Distribution
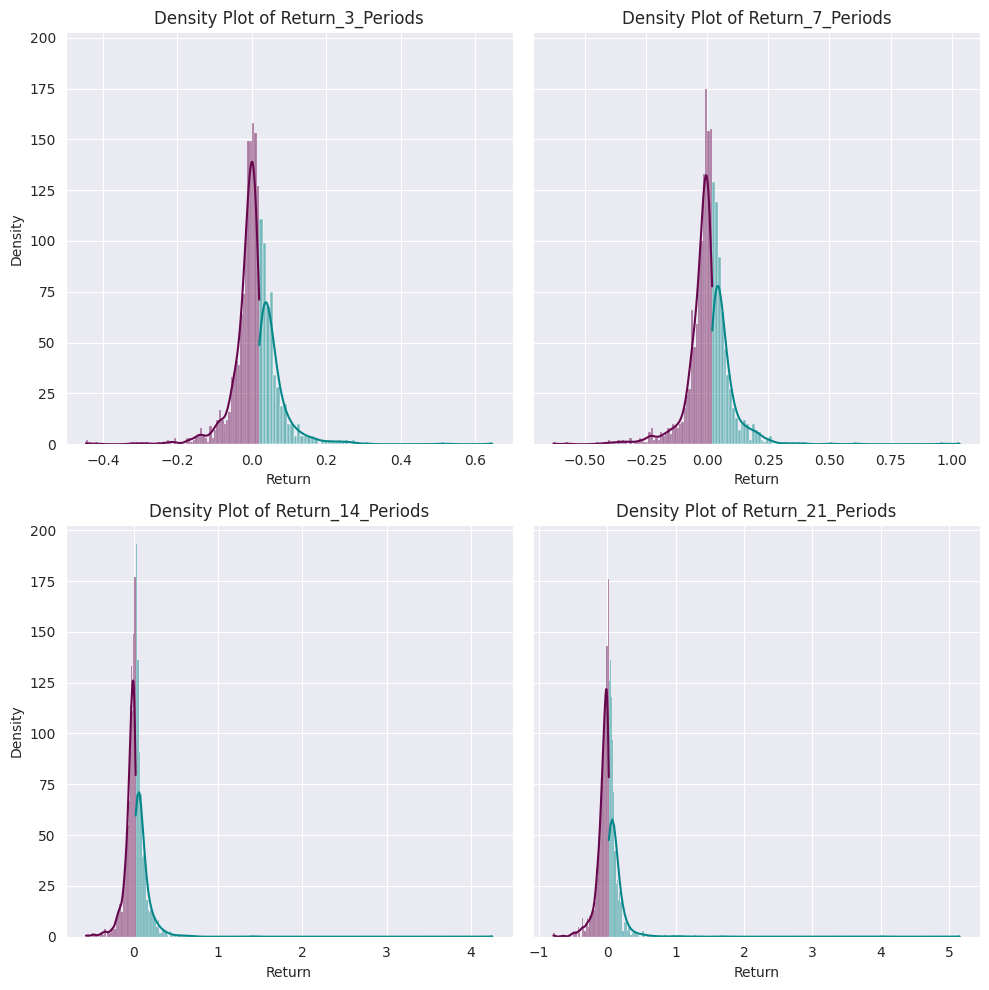
| Return Period | % of Events Above 2% | Mean Return | Standard Deviation | Sharpe | Sortino |
|---|---|---|---|---|---|
| 3 Days | 29.1 | 0.3 | 6.1 | -0.21 | 0.03 |
| 7 Days | 34.8 | 0.2 | 9.0 | -0.13 | 0.02 |
| 14 Days | 40.3 | 0.8 | 15.5 | -0.1 | 0.03 |
| 21 Days | 44.0 | 1.1 | 21.4 | -0.09 | 0.02 |
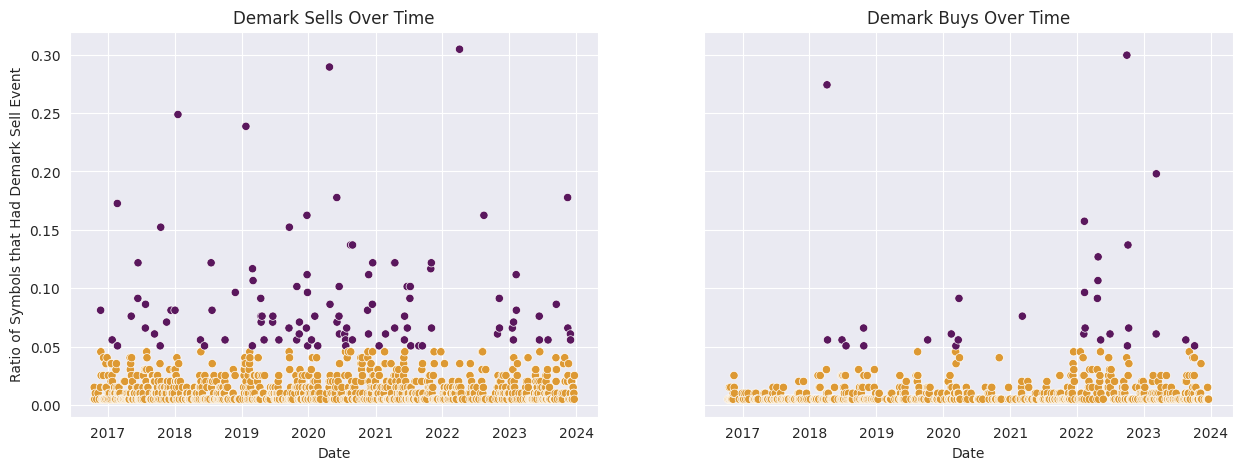
Question: Do these happen across stocks?
Sort of, sometimes. Most likely corresponding to big events in the market/data release.
Top Dates by Percent of Symbols with Demark 13 Sell Events
- 2020-09-30 – 30%
- 2018-04-06 – 28%
- 2023-03-10 – 20%
- 2022-02-10 – 16%
- 2022-10-06 – 14%
Top Dates by Percent of Symbols with Demark 13 Buy Events
- 2022-04-04 – 30%
- 2020-04-24 – 29%
- 2018-01-18 – 24%
- 2019-01-24 – 23%
- 2023-11-15 – 18%
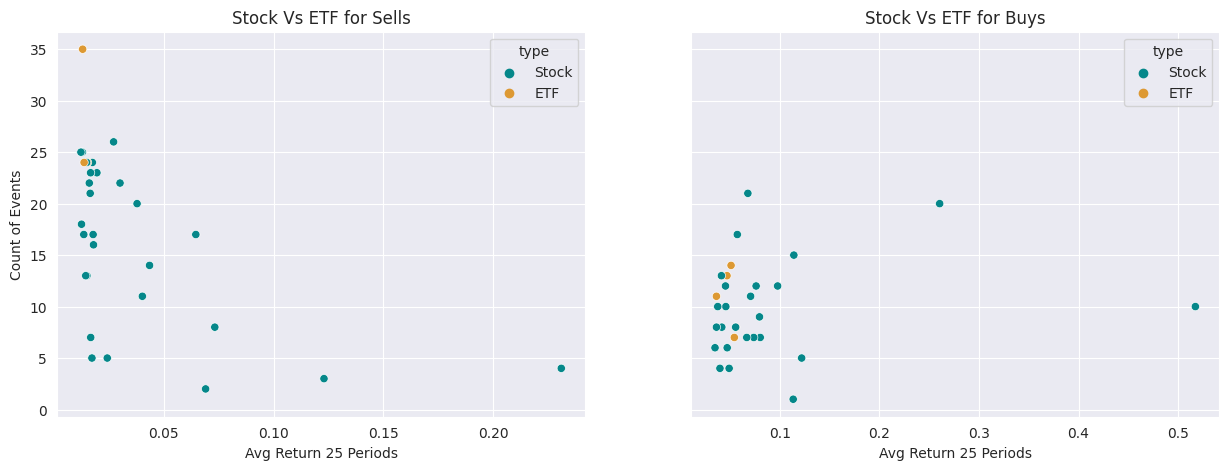
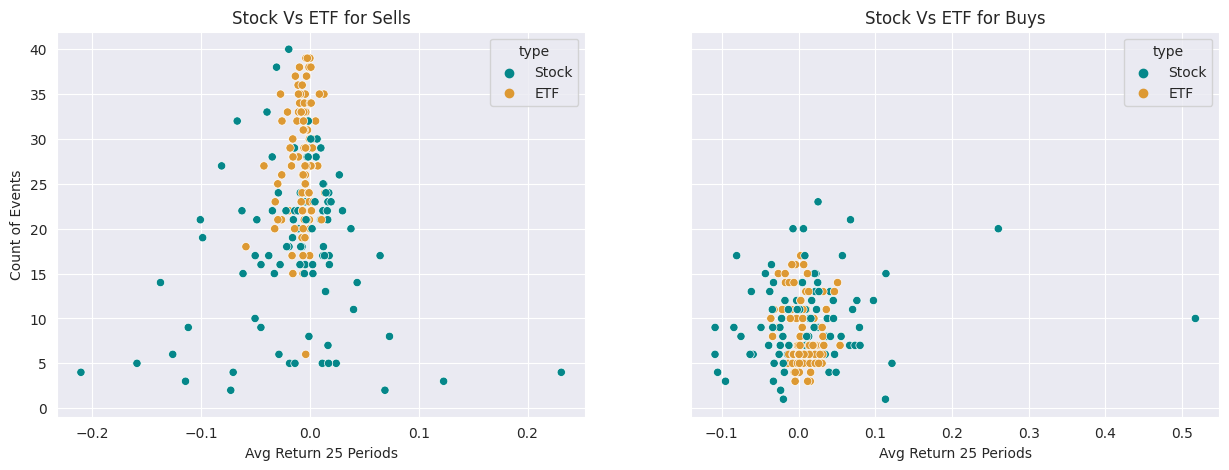
Questions: Does ETF/Stock have an impact on success?
Yes, Stocks have higher variance and thus higher upside. ETFs often don’t break the 5% hurdle so I’ll pass on them from including them in a screen.
Why Any relation to the type of stock?
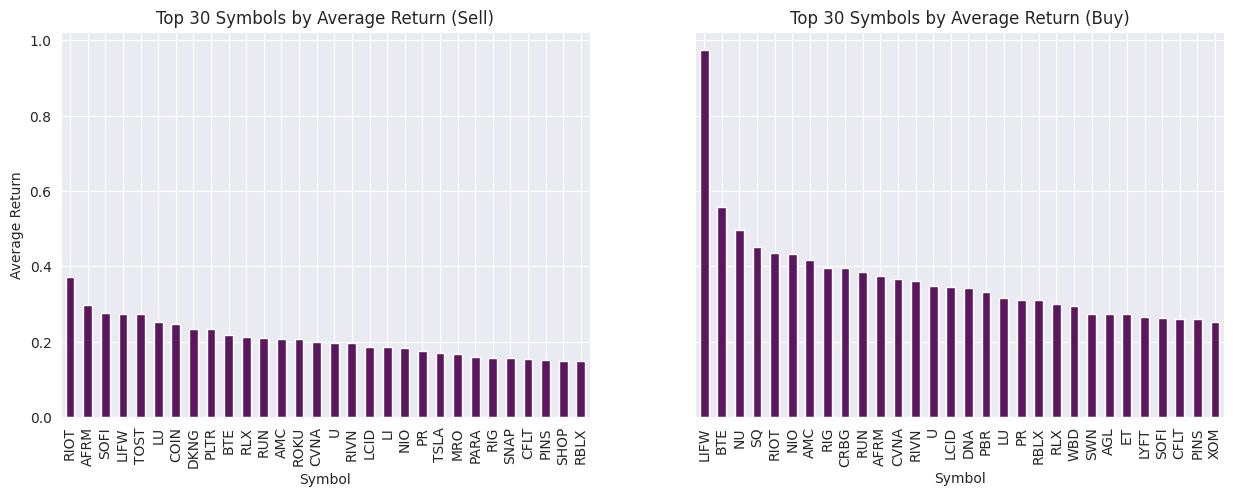
Looking at the names in the highest average of returns, they are High Momentum, High Beta, Tech, Energy. This is intuitive, since those equities have higher variance and have more pronounced trends.
Top Symbols and Return Profile