
The internet is a gold mine for data analysts. Whether you are using google trends to identify search patterns, social media postings to judge sentiment, or analyzing company data for a potential investment, it’s all there. The only problem is turning the data into a usable format.
HTML (Hypertext Markup Language) is the language that provides the basis for websites. In order to “scrape” websites you’re going to have at least have a basic understanding of HTML. You don’t need to be an expert but you should be able to order food and ask where the bathroom is.
In addition, before you go crazy with pinging requests on people’s websites you need to see if there are any rules in place. Standard practice is to check “www.website.com/robots.txt” for guidelines and restrictions. Limiting your requests to one request per page per second is a good way to not overload the servers.
My browser of choice is Google chrome because I like whoring out my data to the man and they have the inspect function which shows the html on a given webpage. The inspect function also makes webscraping easy as you can quickly identify which pieces of the website you wish to scrape.
Financial data is usually pretty accessable. But I am not about to pay $3000/month for a Bloomberg terminal. So doing a little more work is the cost of doing business. As I will demonstrate gathering some data from the US Treasury is easier than you would expect.
On the Treasury’s website they have the daily yield curve data going back to 1990. While this is not a complete dataset, 30 years isn’t bad. Here is what the page looks like and you can reach it here.
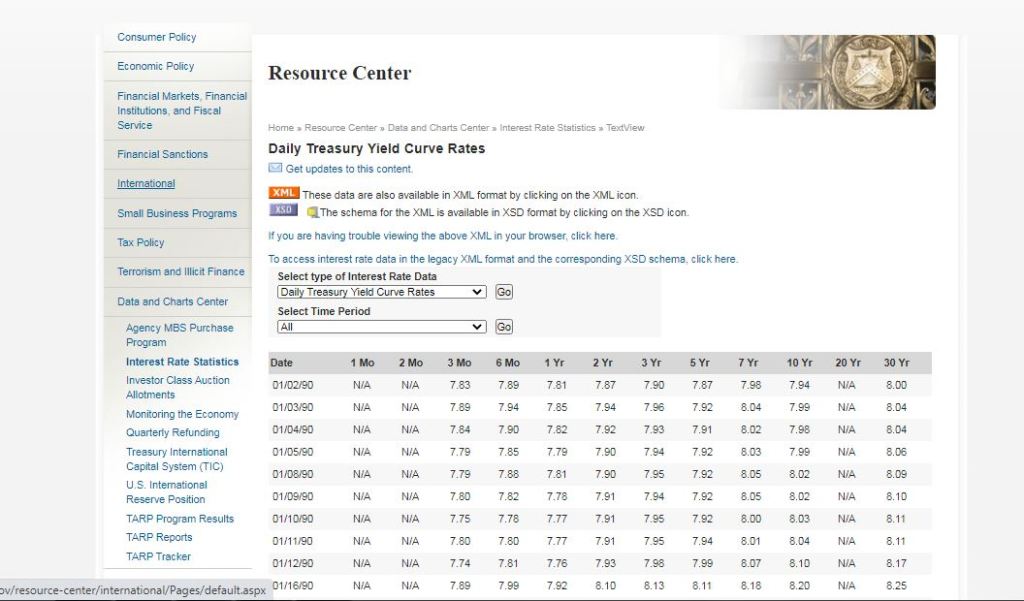
As you can see its nice and structured, so all we need to do is identify the table object its contents. Here is the HTML for when you inspect the table.
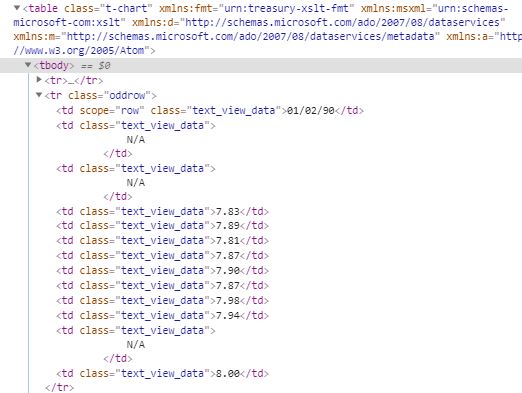
What is important from this is the <table class=”t-chart” which is the table object, <tr> refers to the rows, and <td> which is for each row value. The functions from beautiful soup I used for this are “find()” to identify a specific object the table and the and “find_all()” for the rows and values. Finally to extract the text from an element the function “.text.strip()”. The code below does the trick to gather all of the data.
import pandas as pd
import requests
from bs4 import BeautifulSoup
url = 'https://www.treasury.gov/resource-center/data-chart-center/interest-rates/Pages/TextView.aspx?data=yieldAll'

r = requests.get(url)
html = r.text
# gathering the web page and creating a dataframe of the treasury history
soup = BeautifulSoup(html)
table = soup.find('table', {"class": "t-chart"})
rows = table.find_all('tr')
data = []
for row in rows[1:]:
    cols = row.find_all('td')
    cols = [ele.text.strip() for ele in cols]
    data.append([ele for ele in cols if ele])
Some code to clean up the data frame and change the data types so it can be analyzed.
tre_hist.replace(to_replace='N/A', value=0, inplace=True)
tre_hist = tre_hist.astype({'One_Mo':'float64', 'Two_Mo':'float64', 'Three_Mo':'float64', 'Six_Mo':'float64', 'One_Yr':'float64', 'Two_Yr':'float64', 'Three_Yr':'float64', 'Five_Yr':'float64', 'Seven_Yr':'float64', 'Ten_Yr':'float64', 'Twenty_Yr':'float64', 'Thirty_Yr':'float64'})

tre_hist['Date'] = pd.to_datetime(tre_hist['Date'], format="%m/%d/%y")
print(tre_hist.head())
------------------------------------------------------------------

        Date  One_Mo  Two_Mo  Three_Mo  Six_Mo  One_Yr  Two_Yr  Three_Yr  \
0 1990-01-02     0.0     0.0      7.83    7.89    7.81    7.87      7.90
1 1990-01-03     0.0     0.0      7.89    7.94    7.85    7.94      7.96
2 1990-01-04     0.0     0.0      7.84    7.90    7.82    7.92      7.93
3 1990-01-05     0.0     0.0      7.79    7.85    7.79    7.90      7.94
4 1990-01-08     0.0     0.0      7.79    7.88    7.81    7.90      7.95

   Five_Yr  Seven_Yr  Ten_Yr  Twenty_Yr  Thirty_Yr
0     7.87      7.98    7.94        0.0       8.00
1     7.92      8.04    7.99        0.0       8.04
2     7.91      8.02    7.98        0.0       8.04
3     7.92      8.03    7.99        0.0       8.06
4     7.92      8.05    8.02        0.0       8.09
Now that we have a nice data frame of the daily Treasury Yield we can do further analysis. Stay tuned for my next post where I perform analysis on the 2 and 10 Treasury yield inversion as a leading indicator for stocks.
