


“Hard times create strong men. Strong men create good times. Good times create weak men. And, weak men create hard times.”
G. Michael Hopf, Those Who Remain
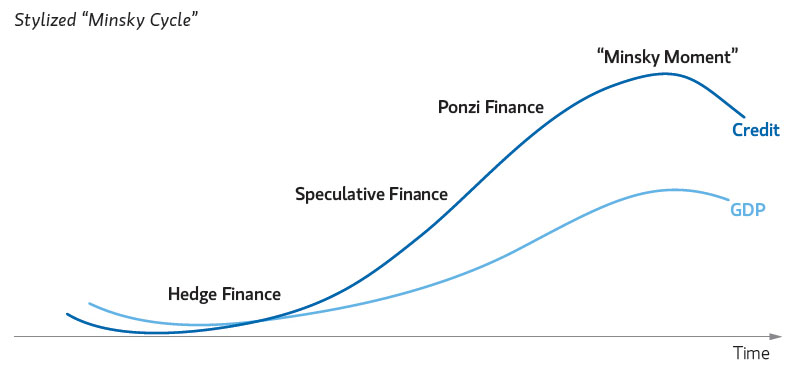
As a general matter, emergent properties occur when a system exhibits behavior that it’s component parts could not produce individually. Basically, in complex systems, shit just happens. In financial markets, one of these emergent properties is exhibited by periods of prolonged stability with eventual devolution to instability. Conversely, a period of instability will lead to stability. The transition between stability (low volatility) to instability (high volatility) in economics is known as a Minsky moment.
A Minsky Moment is a sudden, major collapse of asset values that marks the end of the growth phase of a cycle in credit markets or other business activities. This phenomenon is a great example of the risk inherent in recency bias. Since cycles govern everything, especially in financial markets, it is important for investors to be able to identify signs that the credit cycle may be turning.
https://www.amgfunds.com/theboutiqueinvestor/2019/10/anticipating_the_next_minsky_moment.html
Many people involved in finance will tell you that you can’t time markets. While this is true that no mere mortal can repeatably call the tops and bottoms with a degree of certainty, a good investor should be aware of where in the current market cycle we exist and make asset allocation decisions accordingly. Howard Marks wrote a whole book about it, and if you’re in the game, it’s worth a read.
If you are caught with your pants down during a Minsky Moment, nobody is going to feel sorry for you. On Sept 3rd, 1929 about a month and a half before the crash, economist Irving Fisher stated that “Stock prices have reached what looks like a permanently high plateau.” Throughout the 1920’s, many investors bought financial assets on margin expecting the recent past to continue. This created a fragile market where a small price decline started a negative feedback loop which began the Great Depression. As investors, the most important thing we have to do is preserve our capital. Being over-levered at the wrong time can quickly lead to bankruptcy. Ernest Hemingway says it best:
“How did you go bankrupt?”
Ernest Hemingway, The Sun Also Rises
Two ways. Gradually, then suddenly.”
Investing strategies are largely bifurcated between either mean reversion or momentum strategies, also known as called short volatility and long volatility. I have previously written about short and long volatility here. Both strategies have their place, with short volatility performing well before the Minsky Moment and long volatility performing well afterwards.
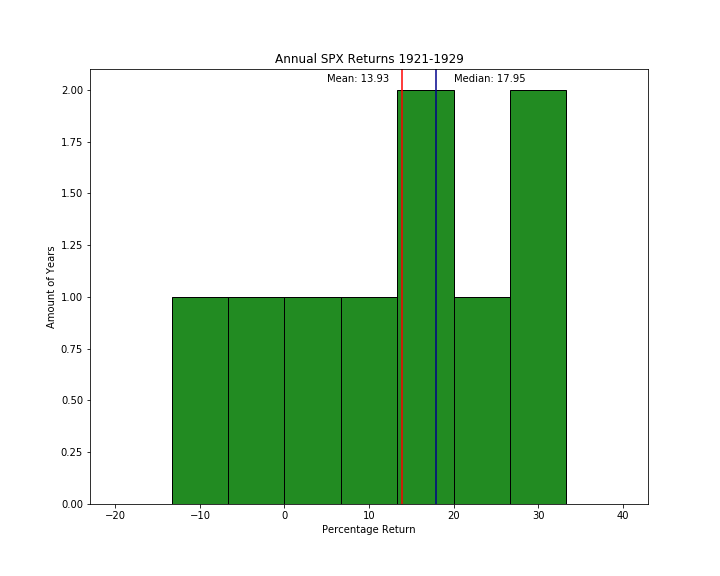
To illustrate this point and present the risks associated with recency bias, I created some charts showing the annual return of the S&P 500 over the past 118 years, since World War II, the roaring 20s, and the 1930s. All charts have the mean and median returns marked with red and blue lines respectively. Note: return figures are not adjusted for inflation and do not include taxes or fees normally required in real world investing.

The distribution of returns since 1900 is skewed to the right with an average return of about 6.85%. This isn’t necessarily bad , but it should be noted that the range of returns was between -40% and 45%, both of those occurred during the 30’s as the markets whipsawed up and down during the Depression.
Now lets compare the 192’s and 1930s. Both distributions charts below. The 20s were a great time for equities, but we all know how that ended (see second chart). The crash in 1929 was a textbook Minksy Moment: investors became complacent with the great returns and took on more risk and leverage, which worked great until it didn’t.
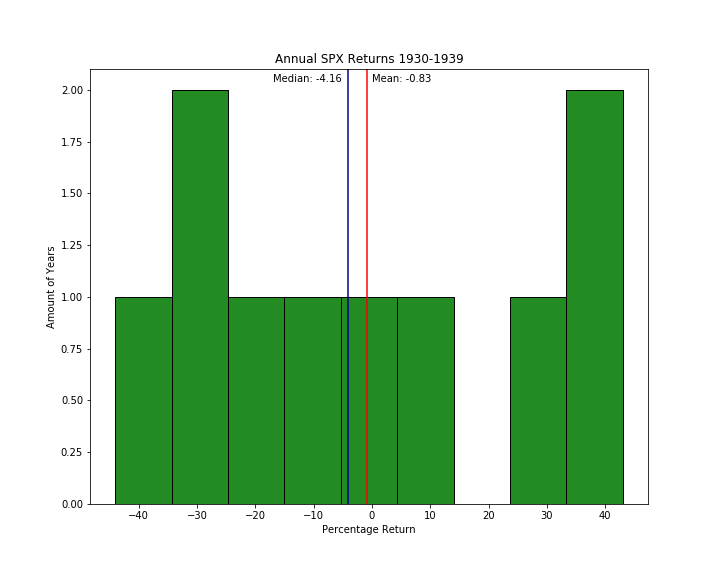
You would be hard pressed to buy the dip and hold onto equities during the 30s assuming you wouldn’t have lost your job and your ability to buy dips. People early in their lives saving for retirement can afford to have a lost decade of returns but those over 40 would have a tough time recovering their retirement savings. That is why it is important to be more defensive with your asset allocation and aware of the risks involved. After all . . .

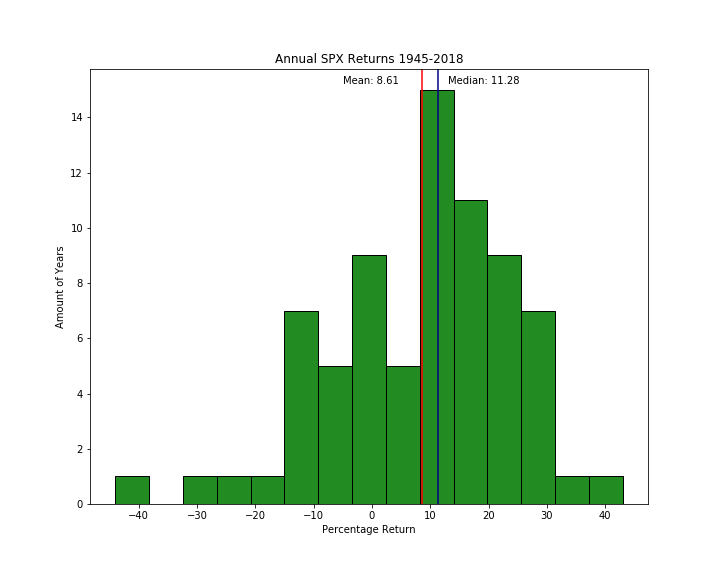
Finally, let’s look at the distribution of returns since World War II. With an average of 8.61% annual return, those with exposure to U.S equities have been handsomely rewarded with a 1.76% premium above the century average. However, one must ask whether this is likely to continue. This period saw favorable demographics (Boomers), interest rates falling from 18.75% to around 1% currently, corporate tax-rates falling from a high of 52.8% to 21%, and the explosion of global trade. These are all major structural tailwinds for equities, and it is highly unlikely that these trends will continue with the same intensity. Of course anything can happen, but the data would indicate that equities will not perform as well as they have in recent history.
Complacency Kills
Every USMC Staff Sergeant ever
Note: I was working on this post before the Coronavirus became the Pandemic it is. Which illustrates that the catalyst for a Minsky Moment does not have to be financial or economic in origin.
Disclaimer
This blog is for entertainment purposed only. Nothing you see her should be considered investment advice, they are just my opinions. I have no credentials to be giving financial advice so consult a professional before making investment decisions.
